Technical Indicators: RSI, MACD, and the Myth of the Magic Signal
Newcomers stack RSI, MACD, and a dozen other indicators on a chart hoping one will whisper the future. They're useful tools and terrible oracles. Here's what they actually measure, and how to use them without falling for the magic-signal fantasy.
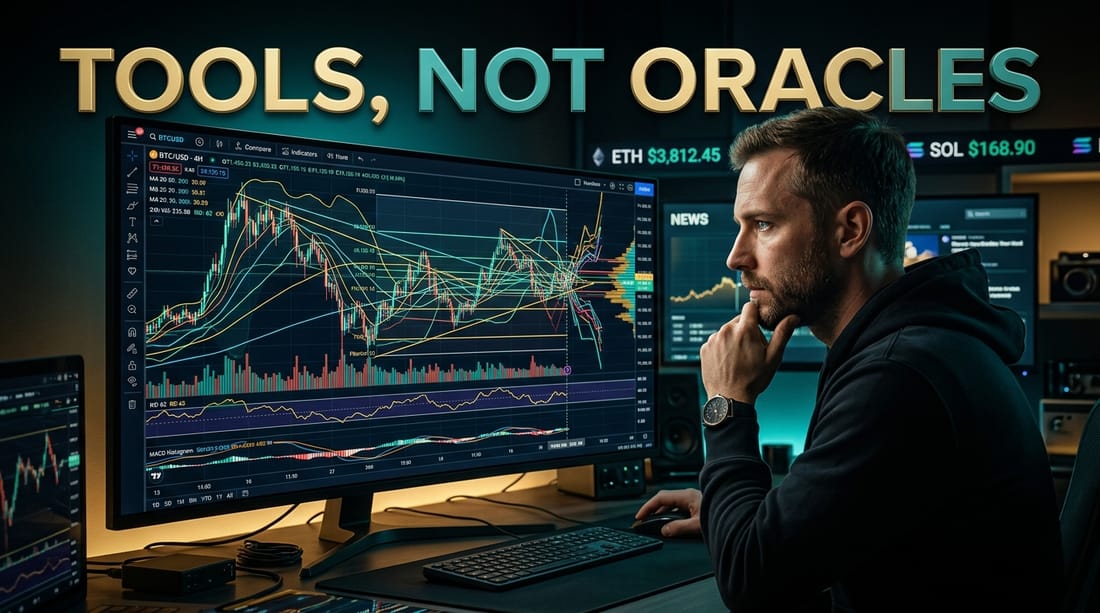
Open any beginner's trading chart and you'll find it buried under a dozen glowing indicators — RSI, MACD, Bollinger Bands, stochastics, a rainbow of moving averages — each one added in the hope that this will be the one that whispers where the price is going. It's a touching ritual and a doomed one. Technical indicators are genuinely useful tools and genuinely terrible oracles, and confusing the two costs people money constantly. Let's clear up what they actually are, what they measure, and how to use them without falling for the magic-signal fantasy.
What an indicator actually is
Strip away the mystique. A technical indicator is a mathematical calculation based on past price and volume data. That's it. You take the history of prices, run it through a formula, and get a line, a number, or a shape that summarizes some aspect of what the price has already done. Every indicator, no matter how exotic, is just a different way of crunching the same historical data into a more digestible form.
Hold onto that, because it's the key to everything: indicators are derived entirely from the past. This single fact, fully absorbed, dissolves most of the magic-signal thinking before we even get to specifics.
What RSI and MACD measure
Take the two most famous as examples, in plain terms.
RSI (Relative Strength Index) measures whether recent price moves have been unusually strong in one direction. It's typically scaled 0 to 100 and framed as "overbought" when high and "oversold" when low. The intuition: if a price has shot up very hard very fast, RSI flags that the move has been intense — sometimes read as "maybe it's due for a pause." Useful framing. But note what it's doing: describing how strong recent moves have been. It's a summary of the recent past, not a forecast.
MACD (Moving Average Convergence Divergence) tracks the relationship between moving averages of the price to describe momentum — whether upward or downward pressure seems to be building or fading. When its lines cross or diverge, traders read shifts in momentum. Again, useful for describing the character of recent price action. And again, it's built entirely from past prices, summarizing what momentum has been doing, not what it will do.
See the pattern? Each indicator takes historical price data and packages one aspect of it into a clearer form. RSI: how strong were recent moves. MACD: how is momentum behaving. They're descriptions of the past, dressed in a way that feels like predictions.
Why they're not magic
Here's the core truth, and it follows directly from what indicators are: because indicators are calculated from past price data, they cannot reliably predict the future. They describe what has already happened. An indicator flashing "oversold" doesn't know the price will bounce — it's just telling you the recent move down was strong. The price can keep falling for a long time while the indicator screams oversold the whole way down. The indicator was never seeing the future; it was summarizing the past, and the past doesn't dictate the future.
This connects to the deepest truth about markets, the same one behind why AI can't predict prices: markets are hard to predict because prices already reflect available information and the future turns on events that haven't happened. No formula run over past prices can escape that. If a simple indicator reliably predicted the market, everyone would use it, their trading would erase the edge, and it would stop working — patterns that become widely known get arbitraged away. The magic signal, by its very nature, can't survive being found.
The fantasy that wrecks beginners: that somewhere in the right combination of indicators is a secret signal that reveals the future. It doesn't exist. Indicators are calculated from the past, so they describe the past, full stop. Stacking ten of them doesn't summon prophecy, it summons confusion and false confidence. The moment you treat an indicator as a command from the market rather than a description of what already happened, it stops being a tool and becomes a trap.
So what are they actually good for?
Rejecting the magic doesn't mean indicators are useless — that's the opposite overcorrection. Used correctly, they have real value:
- Summarizing price action quickly. Indicators distill a messy chart into a clearer read of what's been happening — how strong moves have been, how momentum is behaving. That's genuinely helpful for getting oriented fast.
- Providing context and a framework. They give you a structured way to think about price behavior rather than staring at raw candles. Context, not commands.
- Supporting discipline. A consistent, well-understood framework can help you make decisions methodically instead of emotionally — and emotion, far more than bad signals, is what destroys traders, as the psychology pieces keep showing.
- Confirming or questioning a thesis. Used alongside broader reasoning, an indicator can add a data point that supports or challenges what you already think — never as the sole basis for a decision.
The honest framing: indicators are tools that inform judgment, not oracles that replace it. They help you understand the past and structure your thinking. They do not tell you the future, because nothing can.
How to use them without getting fooled
If you want to use technical indicators sensibly:
- Pick a few you genuinely understand. A couple of indicators you know deeply beats a dozen you've stacked on hope. More indicators means more noise and more contradictory signals, not more insight.
- Treat them as context, never commands. An indicator's reading is one input into your thinking, not an instruction to obey. "RSI is oversold" is information, not a buy order.
- Never rely on a single signal. Combine indicators with broader reasoning — what's actually happening, what moves prices, your overall thesis — and treat agreement across sources as more meaningful than any one flashing light.
- Pair everything with risk management. Since no indicator predicts reliably, you will be wrong often. The professionals' lesson from how hedge funds trade applies: position sizing and surviving being wrong matter more than any signal.
- Kill the magic-signal fantasy for good. The single most valuable mental upgrade is accepting that no indicator or combination reliably predicts the market. Once you stop hunting for the oracle, you start using the tools for what they're actually good for.
The takeaway
RSI, MACD, and every other technical indicator are mathematical summaries of past price data — useful for describing what's already happened, framing context, and supporting a disciplined process. They are not magic signals, and they cannot reliably predict the future, for the simple and unavoidable reason that they're built entirely from the past, in a market whose future is genuinely uncertain.
Use them as tools that inform your judgment, not oracles that replace it. Pick a few, understand them, treat them as context, combine them with real reasoning and strict risk management, and let go of the fantasy that the right indicator stack hides a secret view of tomorrow. The traders who lose are the ones searching for the magic signal. The ones who last understand there isn't one — and use their indicators, clear-eyed, as the modest, genuinely useful descriptions of the past that they actually are.
Frequently asked questions
They're mathematical calculations based on past price and volume data. RSI gauges whether recent moves have been unusually strong in one direction, often framed as overbought or oversold. MACD tracks relationships between moving averages to describe momentum. Both summarize past price behavior.
No, not reliably. Indicators are derived entirely from past price data, so they describe what has already happened rather than foretell the future. They can inform decisions but cannot predict where prices are going, despite how they're often marketed.
Not useless, just misunderstood. They're useful for summarizing price action, framing context, and supporting a disciplined process. The mistake is treating them as magic signals that reveal the future rather than as tools that describe the past and inform judgment.
Use a few you understand well rather than stacking many, treat them as context not commands, never rely on a single indicator's signal, combine them with broader reasoning and risk management, and abandon the fantasy that any indicator reliably predicts the market.
Keep reading




Popular this week
- 01Rug Pulls Hall of Shame: Famous Crypto Exit ScamsAnalysis · 4 min
- 02Grid Trading Bots Explained, and When They Blow UpGuide · 4 min
- 03Where AI and Crypto Actually Meet: Compute, Data, and DePINAnalysis · 9 min
- 04Modular vs Monolithic Blockchains: The Design FightExplainer · 6 min
- 05How to Spot Wash Trading and Fake VolumeGuide · 5 min